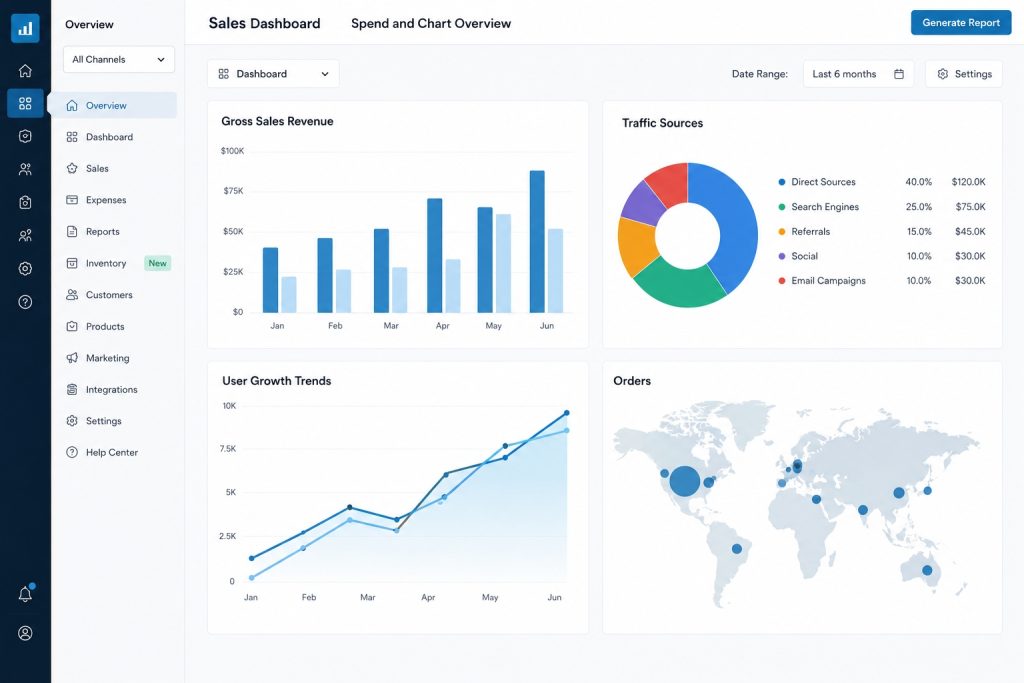
Dynamic reporting tool for generating customizable charts and data visualizations.
Challenge
The client needed a flexible way to generate reports and visualize data without relying on manual analysis or static tools.
Solutions
Creation of a dynamic reporting engine that allows users to build and customize reports and charts in real time.
Technologies and tools
JavaScript, D3.js, Python, PostgreSQ
Client
A data-driven organization requiring frequent reporting across multiple business units. Existing solutions were rigid, time-consuming, and required technical expertise for generating insights.
Challenge: limited reporting flexibility
The organization struggled with:
Static reports that could not be easily customized
Time-consuming manual data processing
Dependence on technical teams for report generation
Lack of real-time insights
This limited their ability to make fast, informed decisions.
Solution: flexible reporting engine
We built a system that allows users to create reports dynamically based on their needs.
Capabilities included:
Custom chart generation with multiple visualization types.
Real-time data querying and filtering.
Exportable reports in various formats.
User-friendly interface for non-technical users.
Scalable architecture for large datasets.
The whole flow is presented below:
Impact: faster insights and decision-making
The solution resulted in:
Significant reduction in report generation time.
Increased autonomy for business users.
Better data-driven decision-making.
Improved accessibility of insights across teams.
Enhanced visualization of complex datasets.